
Head sampling decides when a trace starts, before the system knows whether the request will fail or become slow. Tail sampling waits until spans have accumulated, so it can retain traces because they contain an error, cross a latency threshold or touch a critical service. That makes the evidence more useful, but the decision now requires state: Collectors must hold trace fragments, reunite spans that arrived through different paths, evaluate policies and export the chosen trace before capacity runs out.
OpenTelemetry describes tail sampling as a decision made after a trace's spans have completed, in contrast with a head decision at the root span. Its current Collector processor exposes policies for status, latency, attributes, probability, rate and byte limits, among others. The service-criticality example illustrates differentiated rates, from retaining critical services to sampling a small baseline for low-criticality ones.
This is a current-documentation explainer, not a claim that OpenTelemetry launched tail sampling today. The linked documentation was verified on 29 September 2026. Configuration values below are starting hypotheses; production sizing must come from your own span rate, trace width, lateness and failure budget.
Route complete traces before evaluating them
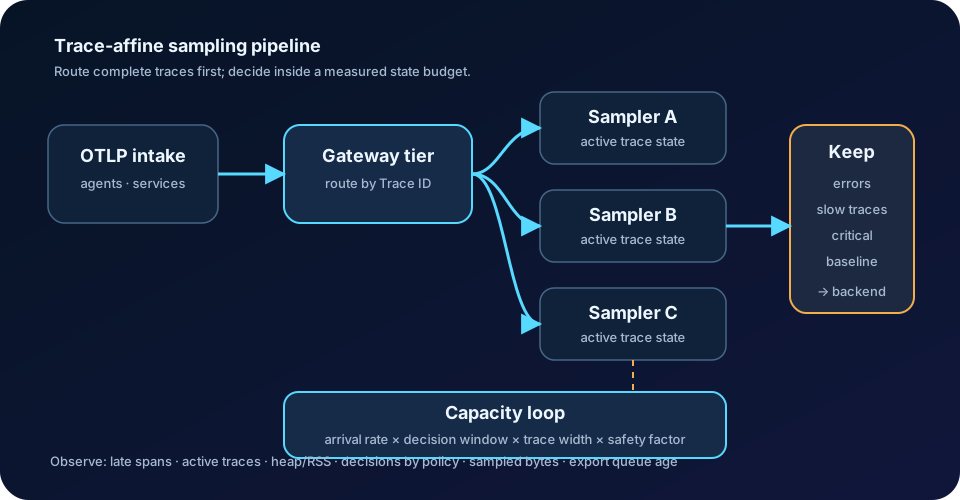
A normal round-robin load balancer can split spans belonging to one trace across several Collector replicas. Each replica then sees an incomplete story and may reach a different decision. OpenTelemetry's gateway deployment guidance recommends a two-tier arrangement for this case: first-tier Collectors use the load-balancing exporter with a trace-ID-aware key, while second-tier Collectors run the stateful tail-sampling processor. All spans for one trace must reach the same second-tier instance.
Keep the first tier as stateless as practical. It receives OTLP, performs only safe preprocessing and routes by Trace ID. The second tier owns the decision window, policy evaluation and decision cache. Export follows only after the trace is kept. This separation lets intake scale for connection volume while the sampler tier scales for active trace state.
Test the routing property, not just endpoint health. Emit a trace whose spans arrive from several services and agents, then verify that one sampler replica observes all of them. Repeat during a rolling deployment, DNS membership change and replica failure. A healthy fleet that fragments traces is still producing unreliable evidence.
Size the decision window as state, not a timeout
The processor's `decision_wait` is the interval after the first span before a decision. A shorter window lowers memory and decision latency, but increases the chance that a slow or late span carrying the error arrives after the decision. A longer window improves completeness while multiplying active state.
Use this planning approximation, then validate it with load tests:
active traces ≈ new traces/second × decision window
memory budget ≈ active traces × average spans/trace × retained bytes/span × safety factor
This is not an OpenTelemetry guarantee and it does not include every Go allocation, cache entry or queue. It is a capacity model that forces the important measurements into the open. Measure distributions, not only averages: one fan-out endpoint can create hundreds of spans, and a burst can exceed the steady-state trace rate. Add Collector runtime overhead, exporter queues and headroom for garbage collection.
Set `num_traces` from the active-trace estimate plus burst margin. Set `expected_new_traces_per_sec` from a realistic high percentile because the processor uses it to preallocate data structures. Increase either value only after confirming the pod memory limit and testing the corresponding heap behavior. A large number in YAML is not capacity if the process cannot retain it.
Turn retention rules into an explicit budget
A useful policy order begins with evidence you cannot reproduce: forced diagnostic traces, errors and unusually high latency. Next come critical services or regulated flows. A small probability baseline for ordinary traffic preserves a comparison group and helps discover unknown failure modes. Finally, cap the total export volume with rate or byte budgets that match the backend contract.
Policy composition needs tests. Multiple top-level policies can retain the same trace, while `and`, `drop` and `composite` change how conditions and allocations interact. The current processor reference documents composite allocation plus rate- and byte-limiting policies. Treat each rule as code: give it an owner, expected selectivity, maximum budget and an expiry date for emergency overrides.
Do not equate a critical label with permission to keep everything forever. The official example uses `service.criticality` to assign different rates, but your taxonomy is only as trustworthy as the resource attributes entering the pipeline. Monitor missing and unknown values. A renamed service that loses its criticality attribute should not silently fall into an unlimited default or disappear from incident evidence.
Design for late spans and overload
A decision cache lets late spans reuse an earlier keep or drop result instead of starting a second decision. Size sampled and non-sampled caches for the observed late-span horizon, and make cache misses visible. If a trace produces spans after the cache expires, decide whether the acceptable outcome is a partial trace, an intentionally dropped fragment or a longer retention window.
The Collector memory limiter can protect the process, but dropping incoming spans under pressure makes trace evidence incomplete. It is therefore a circuit breaker, not a capacity plan. Apply admission control upstream, give the stateful tier bounded queues, enforce backend byte or rate budgets, and alert before the process reaches its hard limit. Under sustained overload, a deliberate reduction in low-value baseline sampling is safer than random span loss across every policy.
The processor reference also documents an experimental, feature-gated tail-storage extension that is disabled by default. Do not treat it as a transparent escape from RAM constraints. Evaluate durability, latency, failure semantics and upgrade compatibility explicitly before relying on experimental external state.
Measure the sampler as a production service
Collect three groups of signals. Input signals include new traces per second, spans per trace, serialized bytes and lateness percentiles. State signals include active traces, heap and RSS, garbage-collection pauses, decision-cache hits, cache misses and traces evicted before decision. Output signals include retained traces, spans and bytes by policy, export queue age, failed sends and backend throttling.
Enable policy attribution where its feature status and operational risk are acceptable, or reproduce equivalent counts through controlled tests. The question is not merely whether the Collector is up. It is whether each policy retained the evidence it promised within its budget. A sudden increase in error traces can correctly raise export volume; a missing criticality attribute can incorrectly suppress it. The dashboard must distinguish the two.
Define an SLO around evidence completeness. For example: among synthetic traces deliberately containing an error span, the expected percentage should reach the backend intact within a bounded time. Run probes for long traces, wide traces, traces with a late error, and traces spanning several services. This tests the complete path from SDK through routing, sampling and export.
Treat sampled traces carefully in analytics
A collection biased toward errors and slow requests is excellent for debugging but is not a raw estimate of traffic composition. Do not calculate product conversion, request volume or global latency percentiles from unequally selected traces without preserving and applying valid sampling probabilities.
OpenTelemetry's TraceState probability-sampling specification defines a shared randomness value and rejection threshold, and explains adjusted count as the reciprocal of sampling probability. It also notes that tail and head sampling may be combined. The Collector processor's TraceState integration remains feature-gated, so verify the exact version and policy composition before claiming statistically correct adjusted counts. Debugging retention rules and unbiased measurement are related, but they are not automatically the same system.
Keep independent metrics for totals and SLOs. Use traces to explain behavior and correlate paths; use counters and histograms designed for aggregation to measure the population. If you derive metrics from sampled spans, record the probability contract and test it end to end.
Roll out through failure-shaped tests
Start with a copy or shadow pipeline that does not replace existing evidence. Replay representative traffic containing routine success, rare errors, slow fan-out, very wide traces, late spans and missing attributes. Compare trace completeness, selected bytes and policy counts against a known answer. Then canary a few services and expand only after the decision window and memory model match observations.
Exercise the failures that change routing or state: kill a sampler pod while it holds traces, add and remove replicas, interrupt the exporter, throttle the backend and restart during a long trace. Confirm that alerts describe lost evidence rather than only pod health. Document the overload mode, rollback switch and maximum acceptable blind interval.
Tail sampling earns its cost when it retains evidence that head sampling would miss. The reliable design is therefore not `tail_sampling` plus a percentage. It is trace-affine routing, a measured state budget, ordered evidence policies, explicit export limits, late-span behavior, statistical honesty and failure tests that prove the evidence survives when the system is under stress.
Official references
These references document the tools discussed. Examples and design decisions are illustrative and should be adapted to the project and its versions.
- OpenTelemetry — Tail-Based Sampling with service.criticality, verified 29 September 2026
- OpenTelemetry — Gateway deployment pattern, verified 29 September 2026
- OpenTelemetry — Agent-to-gateway deployment pattern, verified 29 September 2026
- OpenTelemetry — Tail Sampling: why, how and operational considerations, verified 29 September 2026
- OpenTelemetry Specification — TraceState probability sampling, verified 29 September 2026
- OpenTelemetry Collector Contrib — tail_sampling processor reference, verified 29 September 2026
Prepared by: Noor Yasser
Working through a similar engineering challenge?
I help teams turn architecture decisions into a clear scope and dependable, reviewable implementation.